On the morning of my PhD qualifying exam, I arrived at the conference room at the University at Buffalo’s campus 30 minutes early. One by one, I scribbled each of the dry-erase markers on the stained whiteboard to check which had enough ink. The qualifying exam tests how well students know their field of study and how they problem-solve. I use computer models to study how lakes in western New York State respond to climate change. So, I anticipated the professors on my committee asking me to sketch out concepts like lake thermodynamics and how I’d approach my fieldwork; I was compelled to snuff out any room for error.
I switched on the projector, the screen glowing with my presentation’s title slide: a photo I took of a still lake surrounded by scraggly forest located a few hours from campus.
My computer holds a digital version of the real lakes I study, almost like a video game. The models need several ingredients to run, including weather conditions as well as lake size and shape. In this proxy world, I can change the climate however I want. How do lake water temperatures change when summers are warmer? How much does water level fall in a severe drought? Answers to these questions can help guide policy to protect ecosystems and water resources.
I clicked through the next few slides in my presentation, stopping on a figure showing a year’s worth of lines and dots. The lines represented the computer model’s mathematical predictions. Dots represented real observations, like water temperature, that I’ve measured out in the field. Behind each “dot” was a weekend spent measuring near-freezing water temperatures with gloved hands or long summer days where we paddled our boat through dense mats of lily pads. The plot in my presentation can’t capture that experience, so I found a new medium.
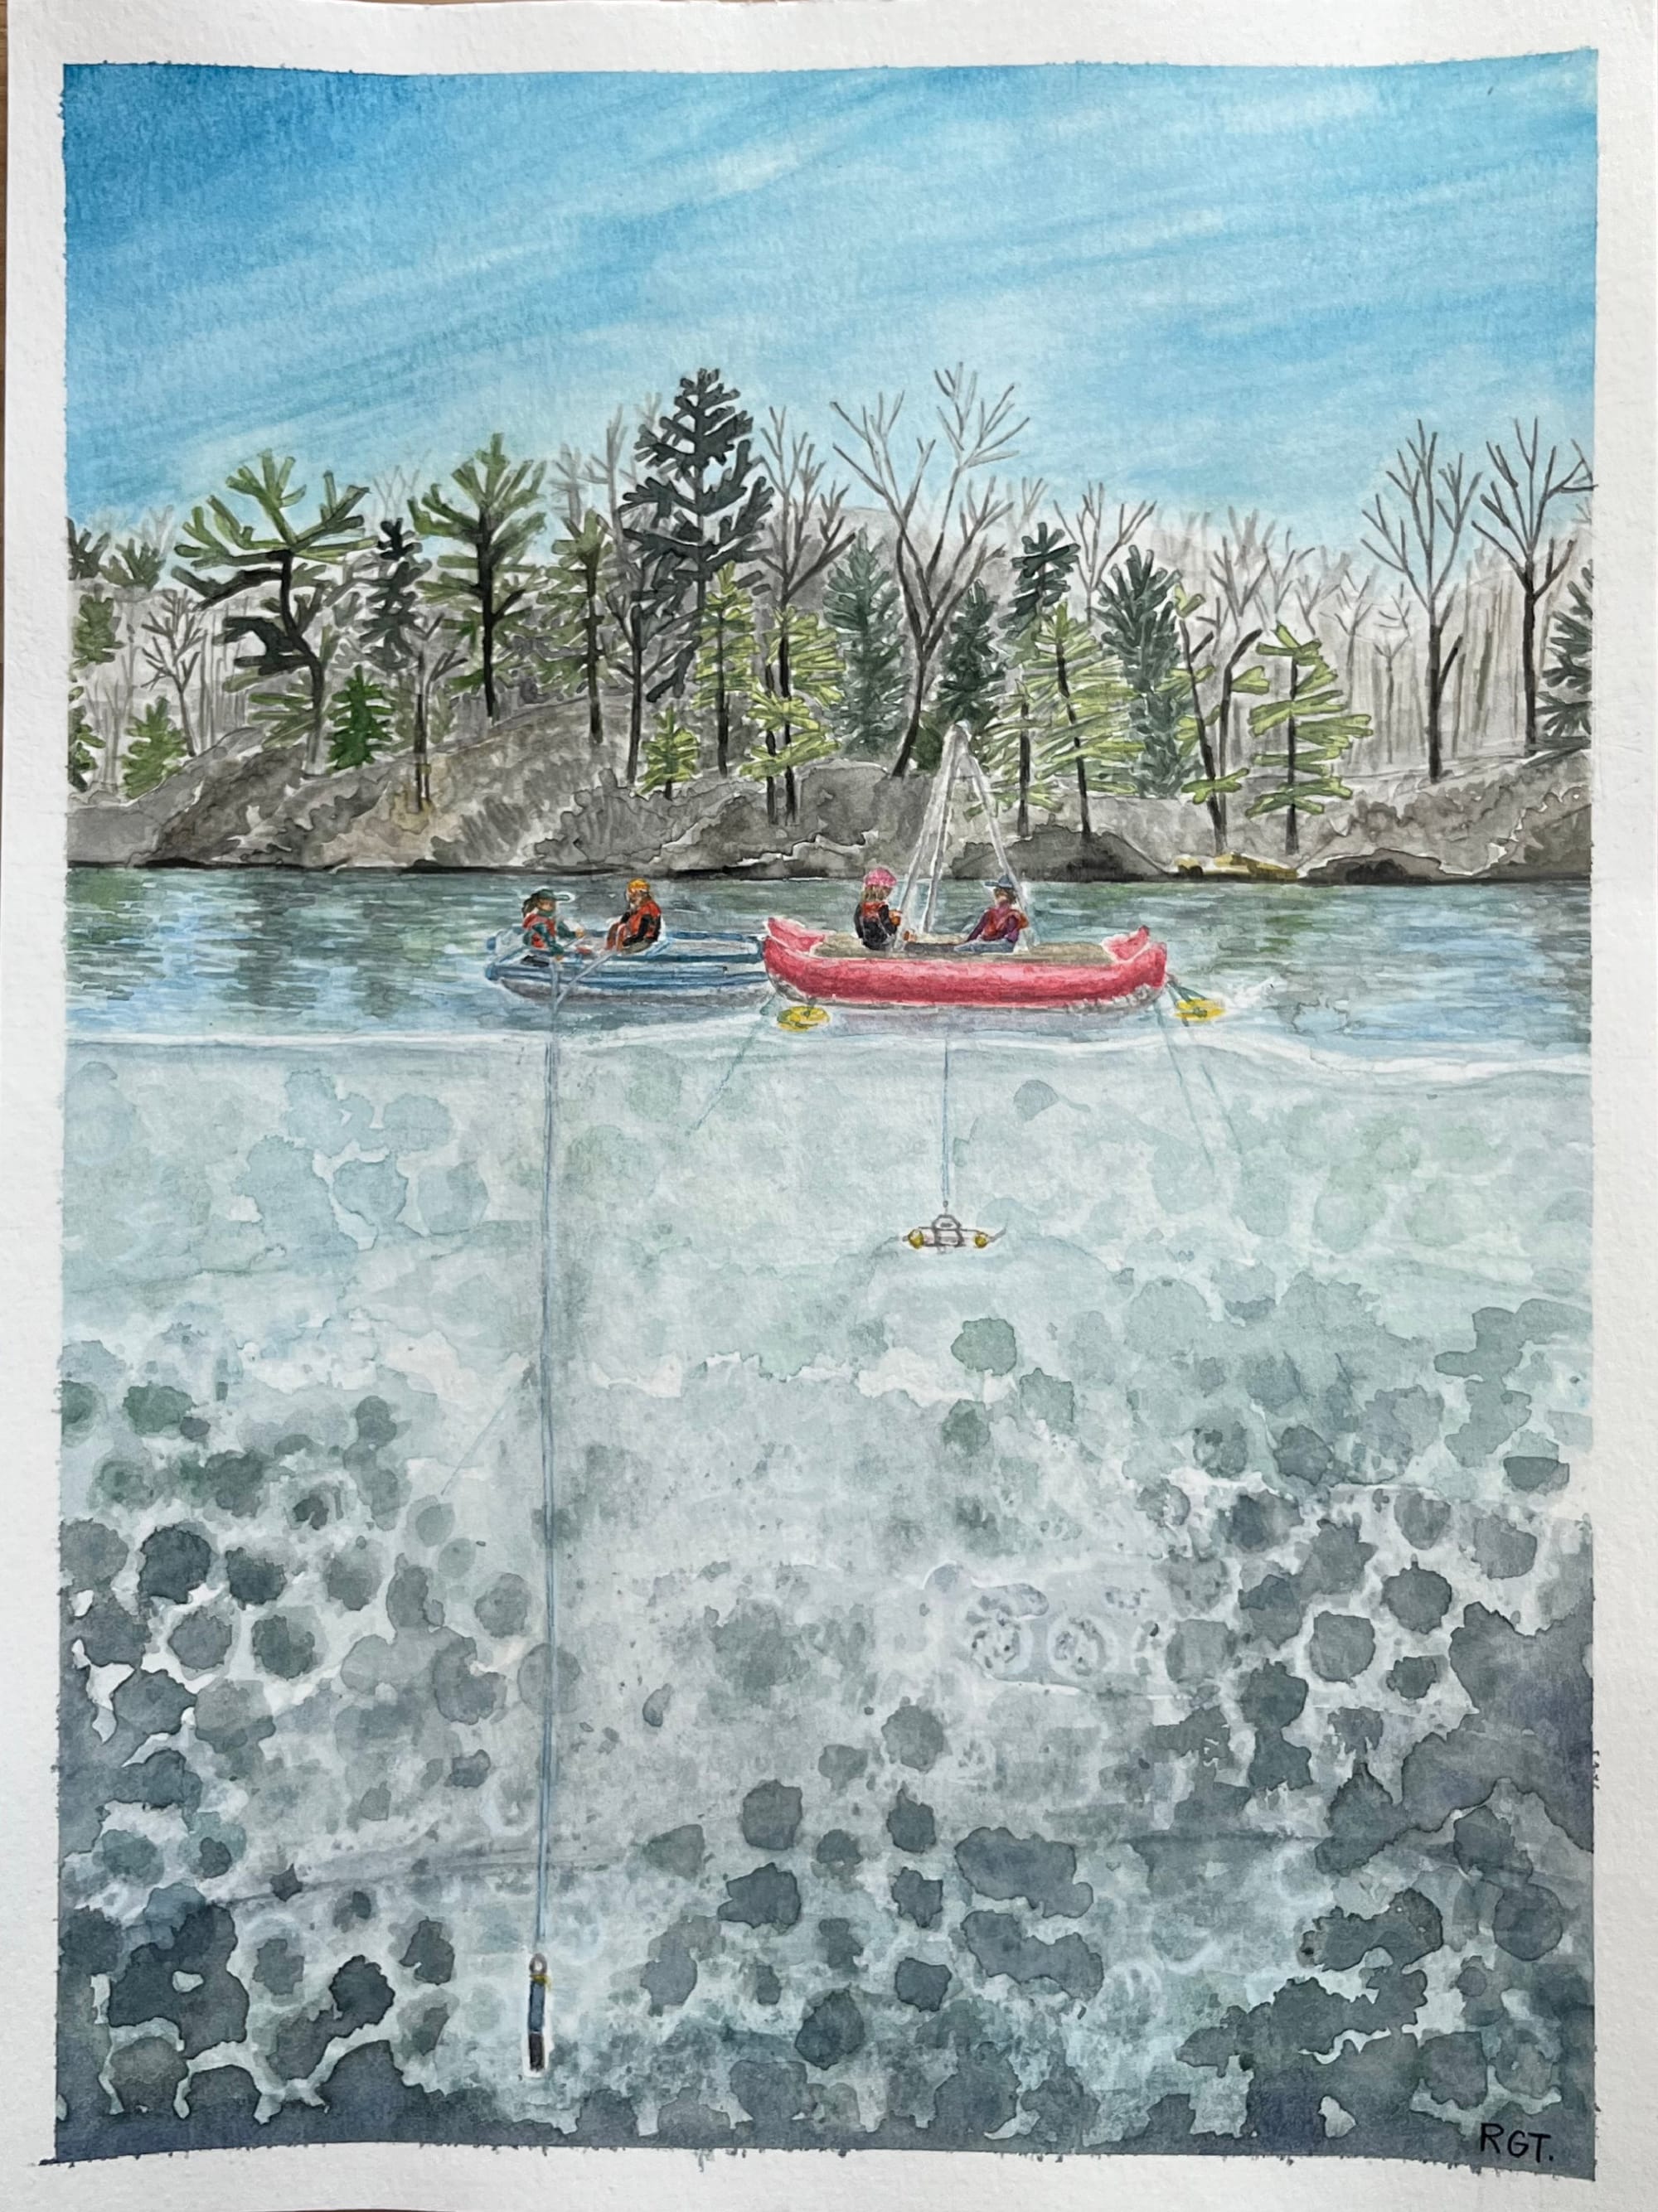
Across the city, another audience was evaluating my research. Customers at a local coffee shop could see watercolor paintings of my fieldwork on display. I have painted the lakes I study in every season. My paintings reveal vertical profiles, inspired by the measurements we take from the surface to the lakebed. In my paintings, heat, color, and texture become brushstrokes, rather than numbers.
When I began translating my science into watercolor, I was surprised by how much the process mirrored research. The paint flows where it wants to flow. Even when I carefully plan how I want a painting to look, I’m constantly adjusting and surrendering to its whims. This same mindset of balancing preparation with adaptability arises in my fieldwork.
On a Wednesday evening in July, 2024, I sat cross-legged on the couch feeling hot and sticky in my Buffalo, New York, apartment. Like two-thirds of the houses in Buffalo, my house was almost 100 years old. No air conditioning then. No air conditioning today. According to climate projections, our summers will only get warmer and wetter. More snow and floods are also on the horizon. My house was not built for this future climate.
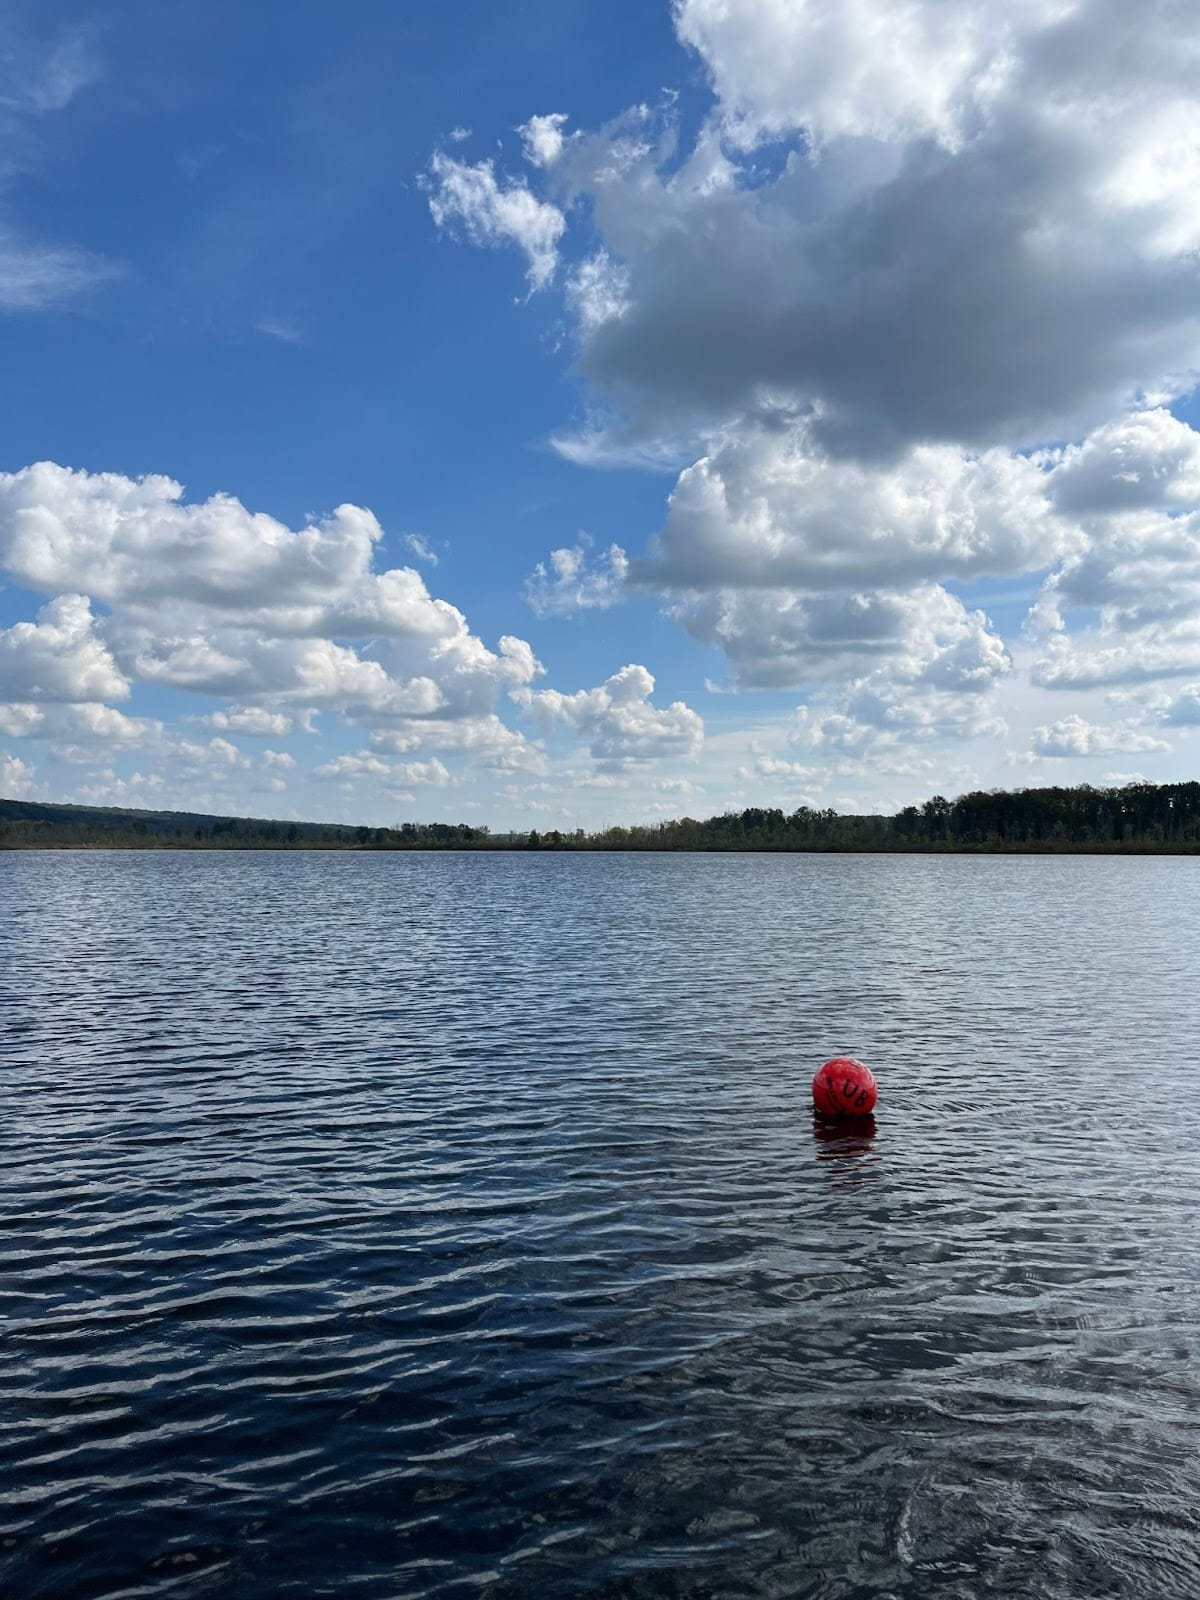
A chirp from my computer announced an email from an unknown address. A bright orange buoy had been found washed up on the shore of Bear Lake, one of the lakes I study for my PhD research. Just the buoy, not the temperature sensors I had attached in the spring. I blinked, and read the email again.
I’d hoped to use that data to check that my model was working as it should. But those temperature sensors, storing hundreds of data points from over two months, were now lost to the murky depths of the lake. I replied to the email, planning to pick up the buoy at an outdoor store near Bear Lake.
Summer water temperature observations are especially useful for benchmarking my models because they capture how a lake warms up. In summer, surface waters become warmer than colder, denser waters below. The temperature difference forms an invisible wall between top and bottom that prevents mixing, like oil and water. I paint this with Cobalt Blue brushstrokes that begin pastel at the surface but darken towards the lakebed, where light and oxygen can barely reach. When cool air chills the water in autumn and spring, the lake will settle on the same temperature throughout, and mix freely like watercolors on paper.
The following week, I loaded up our inflatable Zodiac boat, tools, life jackets, and a clutch of excited undergrads into the University at Buffalo Earth Science department’s twelve-passenger van. A few hours later, the bell above the door jingled over a Grateful Dead song playing on the speakers as we entered the store to get the buoy back. The store manager noted that Chautauqua Lake, sparkling just across the street, was as warm as bathwater today.
And it’s not just western New York. Lakes around the world are changing with climate change. In a world with hotter summers and shorter winters, surface waters are warmer than deeper waters for longer stretches of time than before. Without mixing, the lake bottom becomes starved of oxygen. Algal blooms can dominate the surface, killing fish and making freshwater unsafe to drink.
It remains an open question whether climate change will lead to less lakes mixing seasonally across the U.S., and if these changes will be reversible.
Gravel crunched under the van’s tires when we arrived at the Bear lake boat launch. The last time I did fieldwork at this lake was in the spring, right after the ice melted and the lake was just starting to wake up. When I paint the lakes I study in spring, I use watercolors like Veridian, Gray, and Sap Green, mixing them together like the lake water does at this time of year. But for a summer scene, I prod Emerald and Cadmium Yellow droplets around the smooth paper with my brush to form the leaves and boughs reflected on the bright lake surface.
We inflated the boat with a hand pump, taking turns when our arms got tired in the summer heat. With a splash, we launched the boat into the water and paddled to the deepest part of the lake. There, we’d make our observations.
When I paint lakes in autumn, I use almost all the colors in my palette: Burnt Sienna, Cadmium Red, Yellow Ochre, and Verdi Blue. The lakes I study at this time of year are paradise for leaf-peepers. Fall is a time of change, both above and below. Cool air chills the water and the lake settles on the same temperature from top to bottom, allowing water to mix freely like watercolors on paper.
In winter, ice covers the lake’s surface. This can be tricky for fieldwork. But when the ice is thick enough, we can leave our boat on campus and walk right out onto the ice. Cool temperatures slow chemical activity and mixing for months. I use Cerulean and Burnt Umber to paint winter scenes.
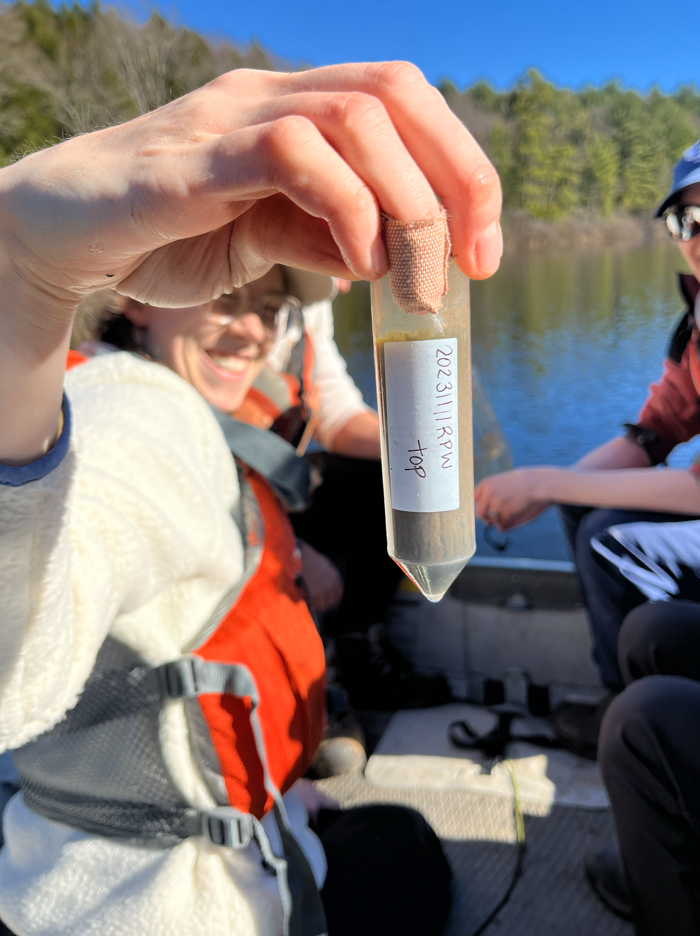
In spring, air temperatures rise, ice thaws, and the lake wakes up. We take water samples, fresh and cold, into bite-sized, four-milliliter glass vials. I brush layers of paint in Veridian, Gray, and Sap Green. The lake water again mixes from top to bottom.
In summer, surface waters become warmer than colder waters below. The temperature difference forms an invisible wall between top and bottom that prevents mixing. I paint this with Cobalt Blue brushstrokes that begin pastel at the surface, but darken towards the lakebed, where light can barely reach."
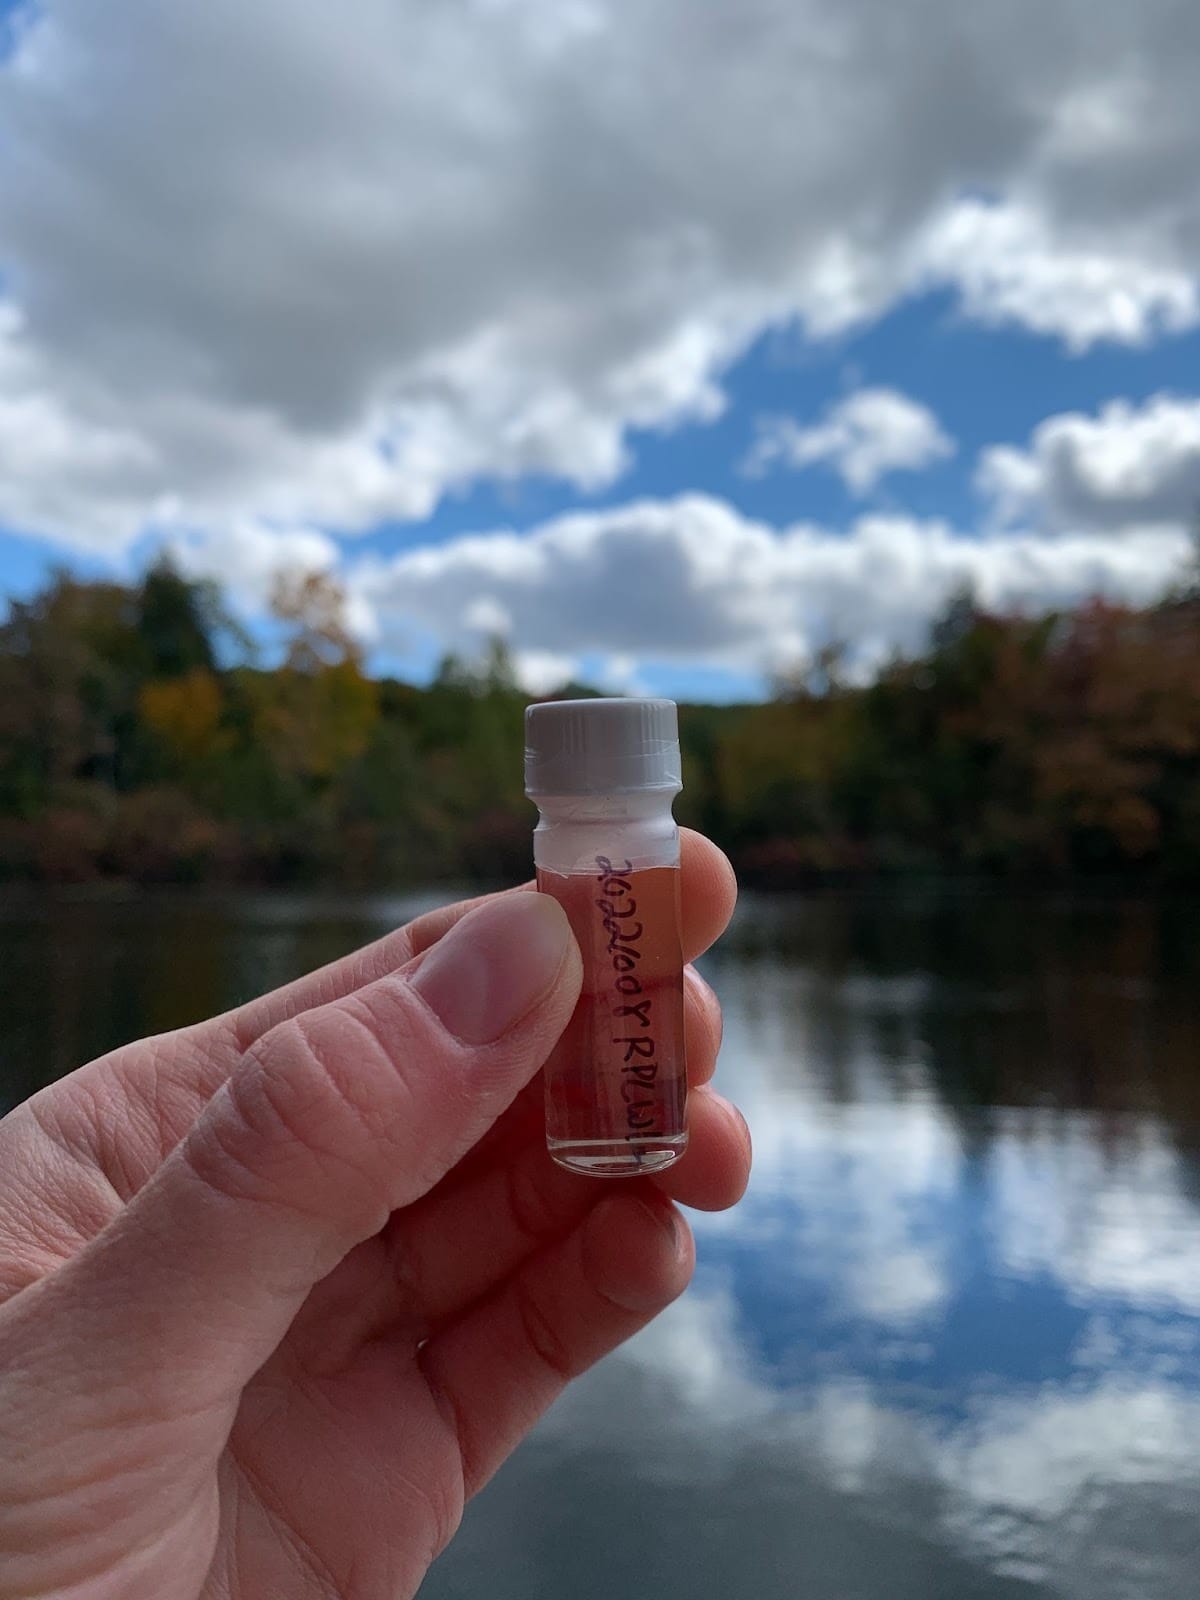
Although the lake seemed peaceful on the surface, sharp gradients of change hid below. We lowered into the lake an elaborate thermometer called a sonde, that also measures water clarity and dissolved oxygen, pausing for measurements every meter. The surface was warm, almost as warm as the air, but the temperature rapidly cooled moving towards the bottom of the lake. We also collected samples of lake water in bite-sized, four-milliliter glass vials.
Water temperature is a key variable that my computer models predict, but the models also simulate other variables that help us learn about how lakes respond to climate changes. One of those variables are the isotopes of hydrogen and oxygen that water contains. When the ratio of one chemical isotope to another changes, it hints at how water moves through the environment.
At the end of our fieldwork day, my team secured brand-new, donut hole-sized temperature sensors to the old buoy, each sensor secured along a neon green rope. One sensor for the surface, middle, and bottom of the lake. The data I get from these sensors will help anchor my model’s predictions of water temperature at different parts of the water column. Each sensor blinked orange, ready to observe how the lake will change in the months until we visit again.
As climate scientists we often say that “all models are wrong, but some are useful.” While neither my computer models nor my watercolor paintings can perfectly recreate the lakes I study, they each capture different aspects of the same story. My models help me investigate how lakes in western New York might respond to a rapidly changing climate. My paintings mirror the experience of collecting data in the field so anyone can learn about my research, even while sipping a latte in a coffee shop.
This essay was produced through Sequencer's Storytelling Mentorship Program. Your support through donations and subscriptions helps early-career scientists and creatives tell stories you won't find elsewhere.
If you can spare a few bucks, consider enabling us to continue this work with a one-time donation or regular subscription. Thank you.